Who can use this feature
👤 Available on Professional and Enterprise plans
🔒 Managers and Contributors can create and edit insights. Users with view-only access can view and comment on insights
Overview
The word 'insight' has a variety of different definitions. In Dovetail, an insight is a specific object type where you summarize and share your research findings in a simple format, connected directly to your raw data. With insights, you can curate a narrative with edit and formatting tools alongside highlight reels as a compelling way to present your data to stakeholders.
Create an insight
You can create an insight as a shareable asset that summarizes key findings and takeaways from data across a project or channel.
Magic insights is in beta!
To help you get started, we recommend that you use pre-defined prompts that will automatically synthesize and structure your data, powered by AI. We call these Magic insights.
These prompts include Product requirements, Feature requests, Actionable opportunities, Research report, and Voice of customer report.
With Magic insight, you can also create your own custom prompt from the title of your insight.
In a project
To create an insight in a project, open
Insightsin your project and select+ New insight.Next, choose how you want to create your insight. You can:
Start from a blank insight;
Select a pre-defined prompt with the help of Magic insights (beta) or;
Enter a title and select
Generate from titlewith the help of Magic insights (beta)
From there, refine your insight. Add text, references, and use formatting and editing tools before sharing with your stakeholders. This insight will live inside the project it was created within.
If you prefer to add data to an insight while manually analyzing your data, another way to create an insight from your project's Highlights page by selecting your highlights, clicking Add to insight, then enter a title for a new blank insight.
In a Channel
To create an insight in a Channel, open a topic, click on a theme and select
New insight.Next, select a pre-defined prompt with the help of Magic insight (beta) to automatically synthesize data points within the theme.
From there, refine your insight. Add text, references, and use formatting and editing tools before sharing with your stakeholders. This insight will live inside
Your Work.
If you are looking to gather evidence from across your workspace and create an insight that is detached from a project, you can do this in Your work by selecting New → Insight. Any insights created from here will be viewable by others in your workspace.
Add data to your insight
Add data to an insight from across your Dovetail workspace using the reference picker.
To do this, open your insight and type
/within the editor to see all available options.Using this menu, select
References. You can search for and filter content by object type (highlights, tags, notes, etc.) to select/drag and drop these directly into your insight.From there, you can customize how the highlight is presented by toggling on or off the content you want to display.
By default, references won’t show project name and creator information. Dovetail will remember your preferences for each subsequent reference that is added.
Create a reel for your insight
You can create and embed a reel that stitches together key highlights created in your project. Learn how to curate and edit a highlight reel in your insight →
Generate a summary
Once data is added to your insight, provide a TL;DR of any long-form report with a magic summary of your insight. Insight summaries pull in information from any content added to an insight, including reels, highlights, notes, text, and documents.
To create an insight summary, open your insight (containing embedded data) and type
/within the editor to see all available options.From there, select
Summarizeand a text summary card will be added at the top of your insight.
Generate summary of survey results
When importing survey data into a project, Dovetail automatically creates an insight of the results. In this insight, you will see a breakdown of each question's results. If your original survey includes single or multi-select data types, you will also have the option to visualize each summary as a chart.
Format, style, and structure your insight
Ease stakeholders through your findings by polishing how text and data is displayed in your insight. In an insight, type / within the editor to see all blocks for formatting and structure options that you can drag and drop with ⋮⋮ anywhere on your page. Learn how to edit and format your insight →
Add a cover image to your insight
Insight cover photos give you a quick way to make your insight more visual with a banner. You can upload your own image as a cover photo or search for one from thousands of free photos using our Unsplash integration.
To do this, click
Update coverand select your image. Once selected, it will be automatically applied and saved to your insight.
Publish and present your insights
Publishing your insight is the last step in creating your insight. When published, the insight will become read-only and will display in presentation mode.
To publish your insight, select
Publishin the top right corner of your insight page.
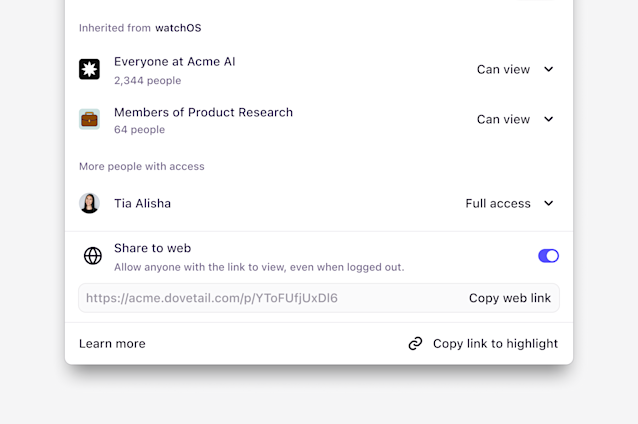
Only published insights are viewable by guests when web link access to your project's insights is enabled.
Once you have a few insights to present to your stakeholders, you can use presentation mode. It’s a way to share your insights in a focused, fullscreen experience, with large font sizes and a horizontal carousel where you can move between insights with the arrow keys.
To do this, open
Insightsin your project and clickPresentin the top right corner to open presentation mode.
Share insights with those outside the workspace
You can share your insights with those outside Dovetail by enabling public access to your project. Learn more about enabling public access to project insights→
Measure impact with insight metrics
Insight metrics help you capture traction and engagement by providing information on who is engaging with your insights and how. These metrics are captured per-insight.
To view an insight's metrics, open your insight, click
View/sand selectMetrics.
Currently, insight metrics capture:
Reached audience: Number of unique accounts that have seen the insight.
Insight discovery: Where users discovered the insight.
Audience role: Who is accessing the insight.
Audience access: What level of access in Dovetail.
Engagement ratio: Percentage of unique accounts who opened content in the insight.
Full page read: Percentage of unique users who scrolled to the bottom of the insight.
Most Popular: Number of unique users who clicked through a link within an insight.
Please note
For privacy reasons, metrics are only tracked for logged in users. Insights shared using a public access link will not have it's metrics tracked.
Update project data on insights
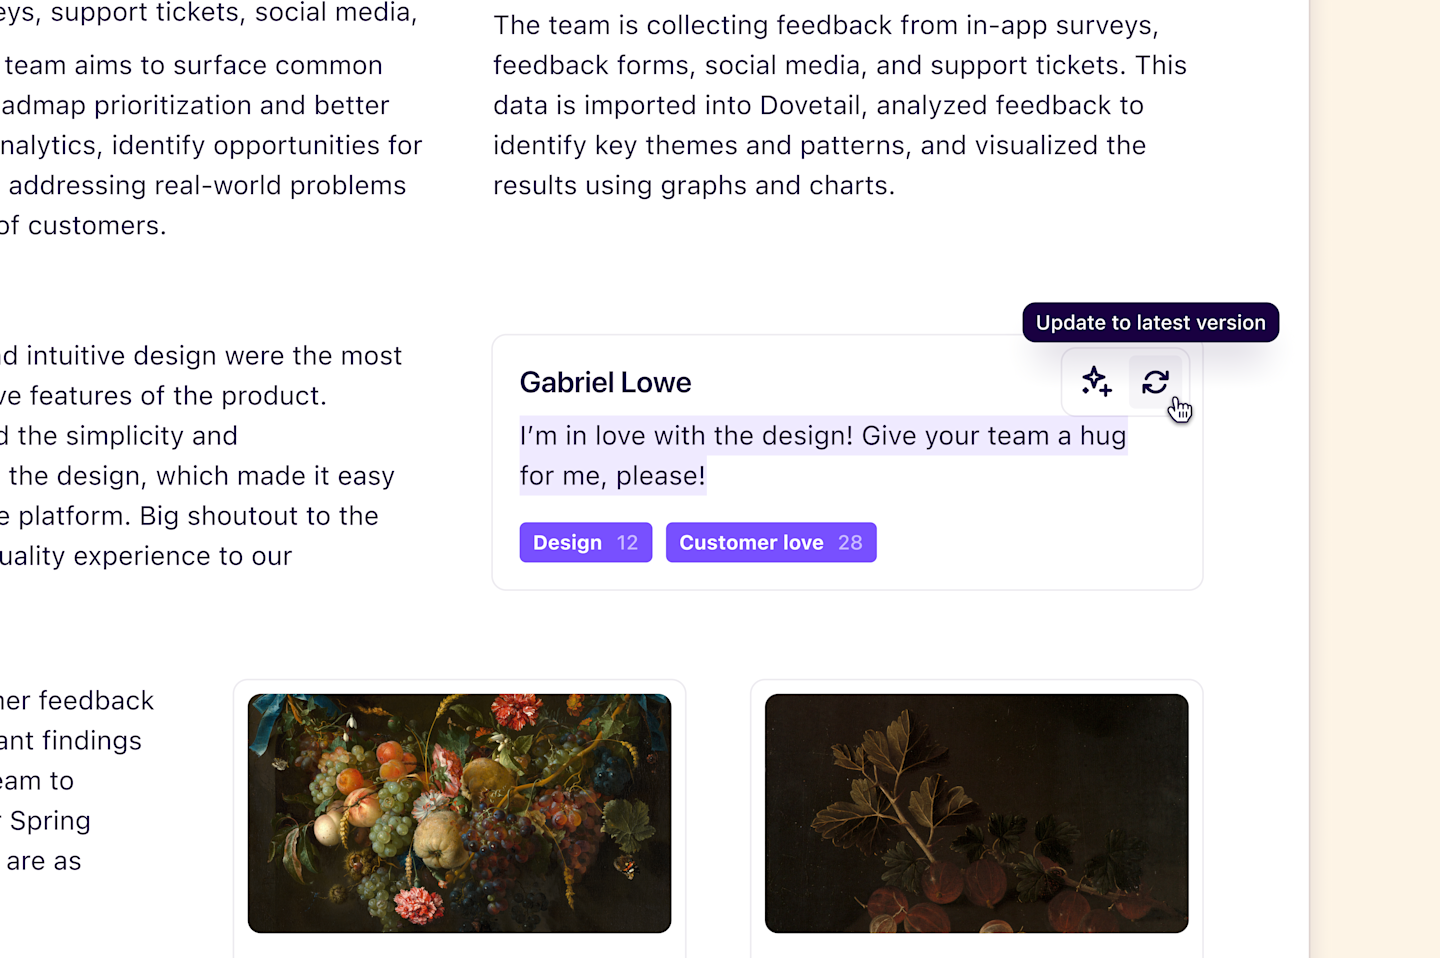
Adding project data (notes, highlights, tags, or insights) to an insight will create a point-in-time snapshot of the object so that it will remain unchanged if the underlying data is modified or deleted.
To update a reference, you must have Manager or Contributor access with Can edit access to the project.
From there, select
Update reference (↻)while hovering over it. You can also update references in bulk by withUpdate allfrom within the insight's menu•••in the top right.

References to objects that have been deleted will be retained, and an alert will appear on the reference to notify users that the underlying object no longer exists.
References in dynamic feeds, such as search blocks, are live blocks that automatically update and will always display the most up-to-date version of any displayed references.
Categorize insights with fields
You can organize and store structured information about and on your insights using fields. Fields help teams categorize findings and support the discovery of prior research in Dovetail. Learn more about fields and how to use them for organizing your insights in the workspace →
When an insight is published, empty fields will be hidden, making the insight cleaner and easier for your team to consume.
Give us feedback
Was this article useful?
Last updated 11 June 2025
Next article

Web links
Create web links to share with others outside your workspace.
Last updated: 10 June 2025
