How to build your Voice of the Customer

What is VoC?
Voice of the Customer (VoC) is a research process that collects and analyzes multi-channel customer feedback. It aims to uncover insights behind customer decisions, perceptions, and requirements to drive innovation for improved experiences and new offerings.
Creating a VoC program helps utilize all the valuable feedback go-to-market teams receive from customers and drives empathy across an organization. Teams to get involved (but are not excluded to): Product, Marketing, Customer Success, Support, and Sales. Any team that interacts with the customer.
How to get started
Have a kick-off session to discuss and decide:
Which customer feedback channels are important
Which teams will be involved, and at what stage
Who will own what tasks e.g. importing data, tagging, analysis, sharing out reports, etc.
What the output from this program will be (usually a report or insight within Dovetail), as well as its cadence, objectives, and key stakeholders
What data to include and how
Some of the most common types of VoC data include in-app feedback, NPS scores, and support tickets. Others channels of data could be customer interviews, sales calls, social media engagement and comments, and community conversations e.g. via Slack. Use our Zapier integration to connect and automate importing data from apps like Airtable, SurveyMonkey, Hubspot, and more. You can also easily import any structured data directly from a Csv.

Start building it out in Dovetail
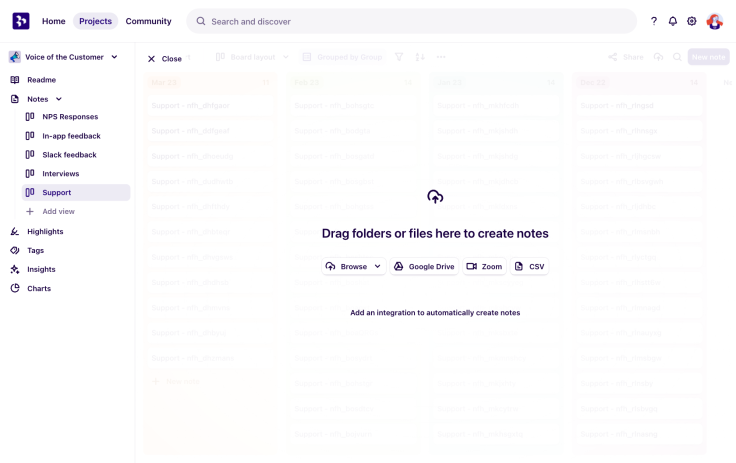
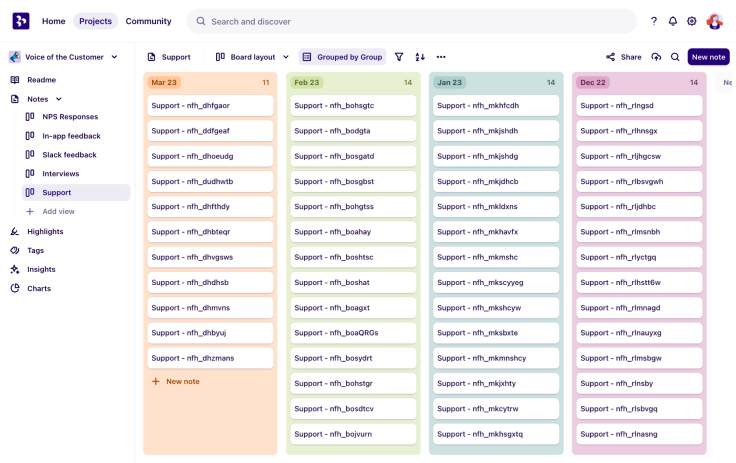
Create a VoC project to store and analyze all of your data. Identify your main listening channels (channels where you hear from the customer) and create a separate note view for each channel to start importing data into. Organizing your data well at this point will streamline the rest of the process significantly. Some tips for this:
Add fields to your notes to structure the data e.g. participant, role, persona, company, research round, etc.
One field to add is the time period to group by e.g. monthly or quarterly, and this will depend on the cadence you’ve chosen. Each board should align to a period e.g. March 2023
Find an example of a note view below.

Turning high-volume feedback into succinct insights
Decide on a tagging taxonomy
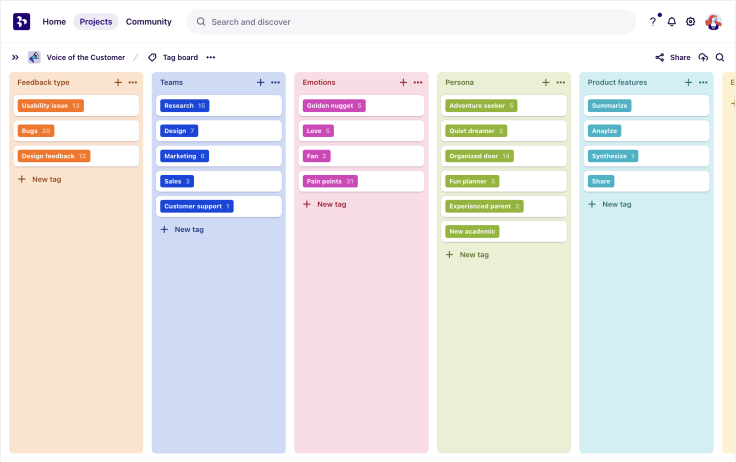
Before analyzing all the data you’ve imported, decide on a tagging taxonomy or global tag board that you will use (this can be defined in the kick-off). The tags should reflect logical themes such as by customer sentiment, core product features, customer personas or customer problems, etc. Your taxonomy will change and evolve as your company and project grow. Find an example to start from below, or use our Voice of the Customer tag board template.

Analyze and synthesize
Now it’s time to highlight and tag up your data. Make sure you’re clear about what teams are responsible for what channel e.g. Marketing is responsible for NPS feedback analysis.
There are various ways to synthesize your data, and Dovetail is flexible enough to suit many mental models. The most common approach is through grouping highlights with affinity mapping on canvas view to identify common themes e.g. a specific feature request, a common pain point, a persona that appears over and over, etc. Some tips here:
Use additional views for affinity mapping e.g. for each team or each core part of the product
Use the bulk tag function to quickly group highlights together
Make affinity mapping collaborative in Dovetail. Bring different teams in, like Customer Success, Marketing, Sales, and even your Engineers, to participate in this task to expose more of the company to feedback and develop more customer empathy
Insights
From these themes that you’ve identified, you can produce individual insights. These can be granular findings or act as more big-picture ideas; both have pros and cons and depend on the process your team has decided on. To create an insight, you can directly go to the insights section of your project, click ‘new insight’ and start pulling in highlights, tags, and other supporting data. Alternatively, you can select relevant highlights from any view and create an insight straight from those. Tips for this process:
Use fields for insights e.g. findings, VoC report
Have an example insight template for consistently formatted findings that are easy to comprehend. Use headings, highlights, and references
Have someone in charge of creating the final VoC report from these individual insights
Have in mind what your final VoC report or output will look like to guide how you structure your insights
Structuring your report for impact
Group your insights in your report in a way that makes sense to your organization. For example by:
Product (for multi-product orgs)
Teams
User journey
Impact (high, medium, low)
Customer sentiment. Make sure to show some customer love too!
Your report should be clearly structured, each section with a maximum of 2-3 key insights to keep it concise and impactful. You can also get creative with these reports and add more context with graphs, images, and videos.
How to maximize VoC impact
Share your report where your teams are
When it’s working well, a VoC begins to create a culture of customer obsession and can help influence product ideas and business decisions. Start by bringing it to where your team is e.g. sharing in Slack, Notion, Confluence, and more with Dovetail’s integrations. You can also present in team demos or even organize a company-wide watch party for a monthly VoC session. When you define the key stakeholders and objectives at the kick-off, this should determine where and how you share the outputs and measure success. For example, the number of views, watches, and reactions, number of comments and conversations sparked, or the number of insights actioned.
Recycle your research
Now that you have a rich hub of customer data, you can do anything with it. When you’re kicking off a new project, use your VoC as desk research to start with. When a new starter is onboarding, point them towards your VoC to bring them closer to the customer. Over time, the VoC can also be directional in discovering or guiding new research projects and areas.


