A guide to sharing insights in ways that stick

The insight-sharing phase of research often receives the least focus, time, and attention in the process. After collecting, analyzing, and synthesizing all our research findings, we rush sharing to “get the insights out there” to relevant teams. All too often, this means they’re shared in ways that are neither memorable nor sticky. A few common symptoms include a confusing storyline tying together key insights, insights shared aren’t tailored to the stakeholders, or the deliverable is packed with words rather than visuals. This compromises their likelihood of being applied, dampening the impact research can have in an organization.
I’ve been tackling this challenge by applying principles from education theory to insights sharing.
Since education theory deals with the absorption and application of data by human minds, it’s also uniquely positioned to help decision-makers in organizations absorb, understand, and retain information needed to make decisions.
Here are four principles I’ve been applying to my insights sharing practice to make the information as sticky and actionable as possible. By allowing stakeholders to interact with insights in a variety of ways, they’ll be more likely to understand, remember, act upon, and in turn, share them further.

What it means
People learn or absorb information in myriad ways. While there is no “right” way of learning, there are three learning styles that try to capture the range of ways people process information. They are: visual, auditory, tactile (and any combination thereof). By including elements of all three, I can cover a wider range of my stakeholders’ different learning styles.
How it can be applied
👀 Visual: people process information best by visualizing or seeing it displayed. For example:
Videos of people showing emotion
Motion animated graphs showing frequencies
User quotes written out on slides
Persona charts
Journey maps
👂 Auditory: people process information best by hearing it spoken to them. For example:
A clear, easy to follow storyline that ties the insights together
Narrating the information on the slide, or describing the visual, rather than just showing it
Hearing quotes from users via recordings or videos rather than just writing them out
Discussing the insights with other stakeholders to hear different perspectives
A video recording of the insights sharing session, rather than the slides
👐 Tactile: people process information via hands-on doing, movement, and physically engaging with information, often simply by trying things out. For example:
Taking notes during the presentation
“Insights museums” that occupy a space, whether physically in an office or virtually on a whiteboard canvas
“Choose your own adventure” gamified style of user journey sharing where the stakeholders can opt for different events happening in the user’s journey to explore the different resulting experiences
Flashcards or persona cards
Experiments to test out the insights (where possible) or prototyping them during a design sprint where insights are immediately applied to ideating a solution
Example
Suppose I assume each insight-sharing session includes an audience of stakeholders with a variety of different learning styles. In that case, an appropriate deliverable might consist of a slide presentation with a combination of user interview video snippets, written quotes, a narrator talking through the slides, discussions of the insights in breakout rooms, and active note-taking spaces.
Make sure your insights are relevant to stakeholders
What it means
It might seem obvious that the insights we share will be more welcome if they’re relevant to the people with whom we are sharing them. But sometimes, we assume information might be relevant to stakeholders without actually making sure it is.
How it can be applied
Before kicking off research projects, I like to take the time to do “internal research” to understand the goals of my stakeholders. I can later tie the insights and recommendations to these goals. I do this in three ways:
Looking at how teams will be assessed over the coming quarter or year (for example, by looking at the team’s OKRs)
Clayton Christensen, former Harvard Business School Professor and author of The Innovator’s Dilemma, once said, “Questions are places in your mind where answers fit. If you haven’t asked the question, the answer has nowhere to go. It hits your mind and bounces right off. You have to ask the question—you have to want to know—in order to open up the space for the answer to fit.”
Bringing key stakeholders together for a workshop exercise to plot out the things they think they know about users, the things they want to know, and the impact that those answers would have on the business. This exercise has the added benefit of forcing stakeholders to come up with the questions about users (creating spaces in their minds for the answers) and simultaneously serving as an opportunity to understand which solutions would be most impactful.
Often during generative research, unexpected insights relevant to teams beyond the original stakeholders emerge. In this case, I set up 30-minute chats to learn about their goals, what they’re working on, and how decisions are made. Then I frame the research insights around these nuggets to speak more relevantly to them.
Example
During a car leasing experience project designed to help product teams prioritize feature development, some insights were relevant to sales teams. I found someone in sales whose goal was to bring more car leasing clients into the business. During our 30-minute chat, she revealed that she needed something to rally salespeople to pursue these new clients. Knowing this, I framed the insights to show how they can be applied by sales teams in pitch decks and product marketers in messaging to focus on key aspects of our product when targeting this audience.
Present your stakeholders with a challenge
What it means
Position an insight as a challenge that the audience cares about. It’s much easier to absorb, and in turn, more galvanizing to act upon.
How it can be applied
Share the challenges that users face, the magnitude of pain the challenges cause, and the resulting implications using narration, video, audio clips, quotes, and photos.
Example
I once needed to convey how much lease car drivers struggled with slow and unresponsive support. I demonstrated the challenge of the owners in three distinct ways:
A colorful, simple journey map showing a flat line that suddenly drops, portraying the magnitude of impact support has on their experience.
Three videos of participants explaining in colorful detail the experience of not receiving support quickly enough
Three full-slide direct user quotes about the monetary and time implications of slow support
Choose quality over quantity of insights shared
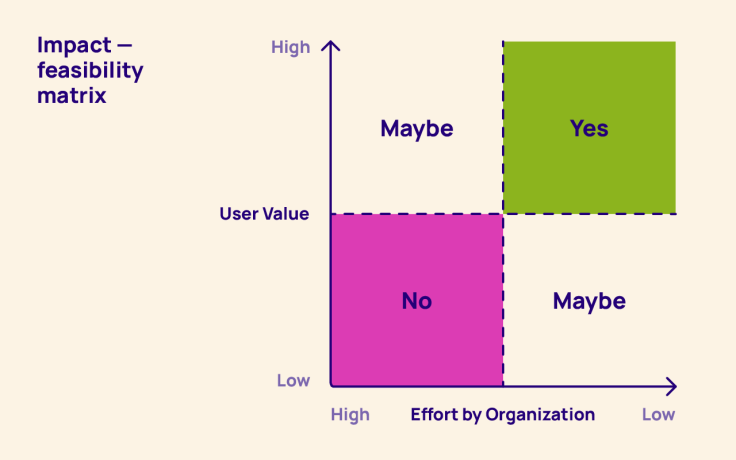
I stick to sharing no more than three key challenges in an insight sharing session. More than that can lead to information overload. To narrow them down, I prioritize the challenges based on the amount of pain to users and the feasibility of resolving them—looping in relevant stakeholders to help make this assessment. We often end up with an impact—feasibility matrix like the one below.

Move people with personal stories rather than statistics
What it means
Studies have shown that people donate more money to causes when they are shown one individual their donation would be supporting, rather than a flurry of statistics, charts, and graphs that de-personalize the impact.
How it can be applied
For example, rather than only showing how many times drivers complained about support, how many tickets they submitted, and how many times it came up in the interviews, I played a video of a single mom explaining in passionate detail the ramifications the slow support has had on the security and happiness of her family.
People repeat actions associated with rewards
What it means
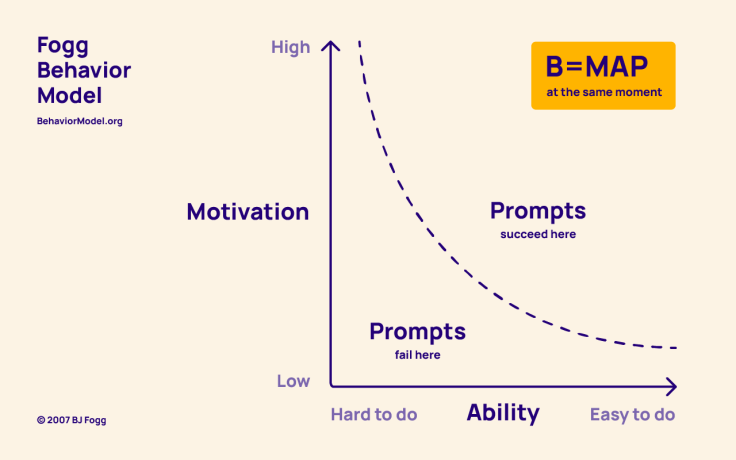
As with anything, when there is an incentive attached to a behavior, that behavior will become more likely. B.J. Fogg’s behavioral model visualized this notion in the graph below. A desired behavior will occur when a person has the motivation, ability, and prompt, all at once.
How it can be applied
Suppose we want stakeholders to apply research insights to decisions. In that case, the insights sharing session can be the “prompt,” ensuring the insights are shared with people with the ability to act upon them can be the “ability,” and peer approval can be a strong motivator for stakeholders to act upon the insights.

Example
Though I believe everyone ultimately wants to give users the best possible experience by resolving their challenges, these good intentions can sometimes be buried under a long backlog of other priorities. In this situation, I’ve found that sharing user challenges far and wide beyond immediate stakeholders can be a helpful nudge to turn insights into solutions, as it creates an environment where stakeholders can keep each other accountable for addressing user challenges.
Creating more recognition for the research practice
Sharing insights in a variety of ways does justice to all the hard work that goes into research. It packages insights in ways that aid their absorption and increases the chance decision-makers will use them. In my experience, this multifaceted insight-sharing approach has the added benefit of creating more visibility and recognition for the research practice within organizations—and nothing is quite as motivating as seeing hard work being put to good use.
Written by Katarina Bagherian, User Experience Research Team Lead, Adyen. Katarina leads the Research team at Adyen. She is a qualitatively-trained researcher obsessed with basing business decisions on reliable user needs. Her fascination for understanding human behavior at the systemic level led her to study Political Science at the University of California, Berkeley. She cut her teeth in applied user research at startups in San Francisco, where she had to prove the impact of research early and often. She developed a passion for making research efficient and accessible as a consultant for entrepreneurs and multinational corporations alike in Amsterdam. Katarina loves spreading the power of user research by guest lecturing at local business innovation university programs. She is always on the lookout for curious researchers to join the growing strategic research practice at Adyen or simply nerd out about creative research approaches.


